Gold Price Forecast for 2023: Analyzing the Potential for Continued Growth
We share the gold price forecast for 2023. We examine the main factors affecting the changes in the precious metal price, specify drivers of possible asset growth and carry out a technical analysis of the price chart. The post Gold Price Forecast for 2023: Analyzing the Potential for Continued Growth appeared first at R Blog - RoboForex.
As at the time of writing, the price of gold dropped by more than 8% from its all-time high of 2,081 USD per troy ounce, which was recorded on 4 May 2023. However, investors are not losing interest in the precious metal. In addition, record purchases by central banks over the past year give hope for a further potential rise in the asset price.
Today we will talk about the current price of gold, how prices have changed in the past and what values they can reach over the next few years. We will examine the main factors affecting the fluctuations in the gold price, specify drivers of possible growth of its quotes, and carry out a technical analysis of the price chart.
How did gold prices change earlier?
Gold was discovered by the ancient Egyptians over 4,000 years ago. They used it to create jewellery and religious items. For the Romans, gold was a symbol of status and power, and it was used to decorate crowns and statues. In the Middle Ages, gold coins were the main means of trade and international exchange. In later periods of history, this metal became the basis of the monetary system.
During the period of the gold standard, since 1887, the US government fixed the gold price at 20.67 USD per troy ounce. Following the abandonment of the gold standard and dollar devaluation in 1933, the cost of the ounce increased to 35 USD and remained at this level until 1967.
In 1971, US President Richard Nixon finally abolished the gold backing of the US currency, which resulted in a significant increase in the value of the precious metal. In the early 1980s, the price reached a record level of 850 USD per troy ounce, but over the next nearly 20 years, it was steadily going down.
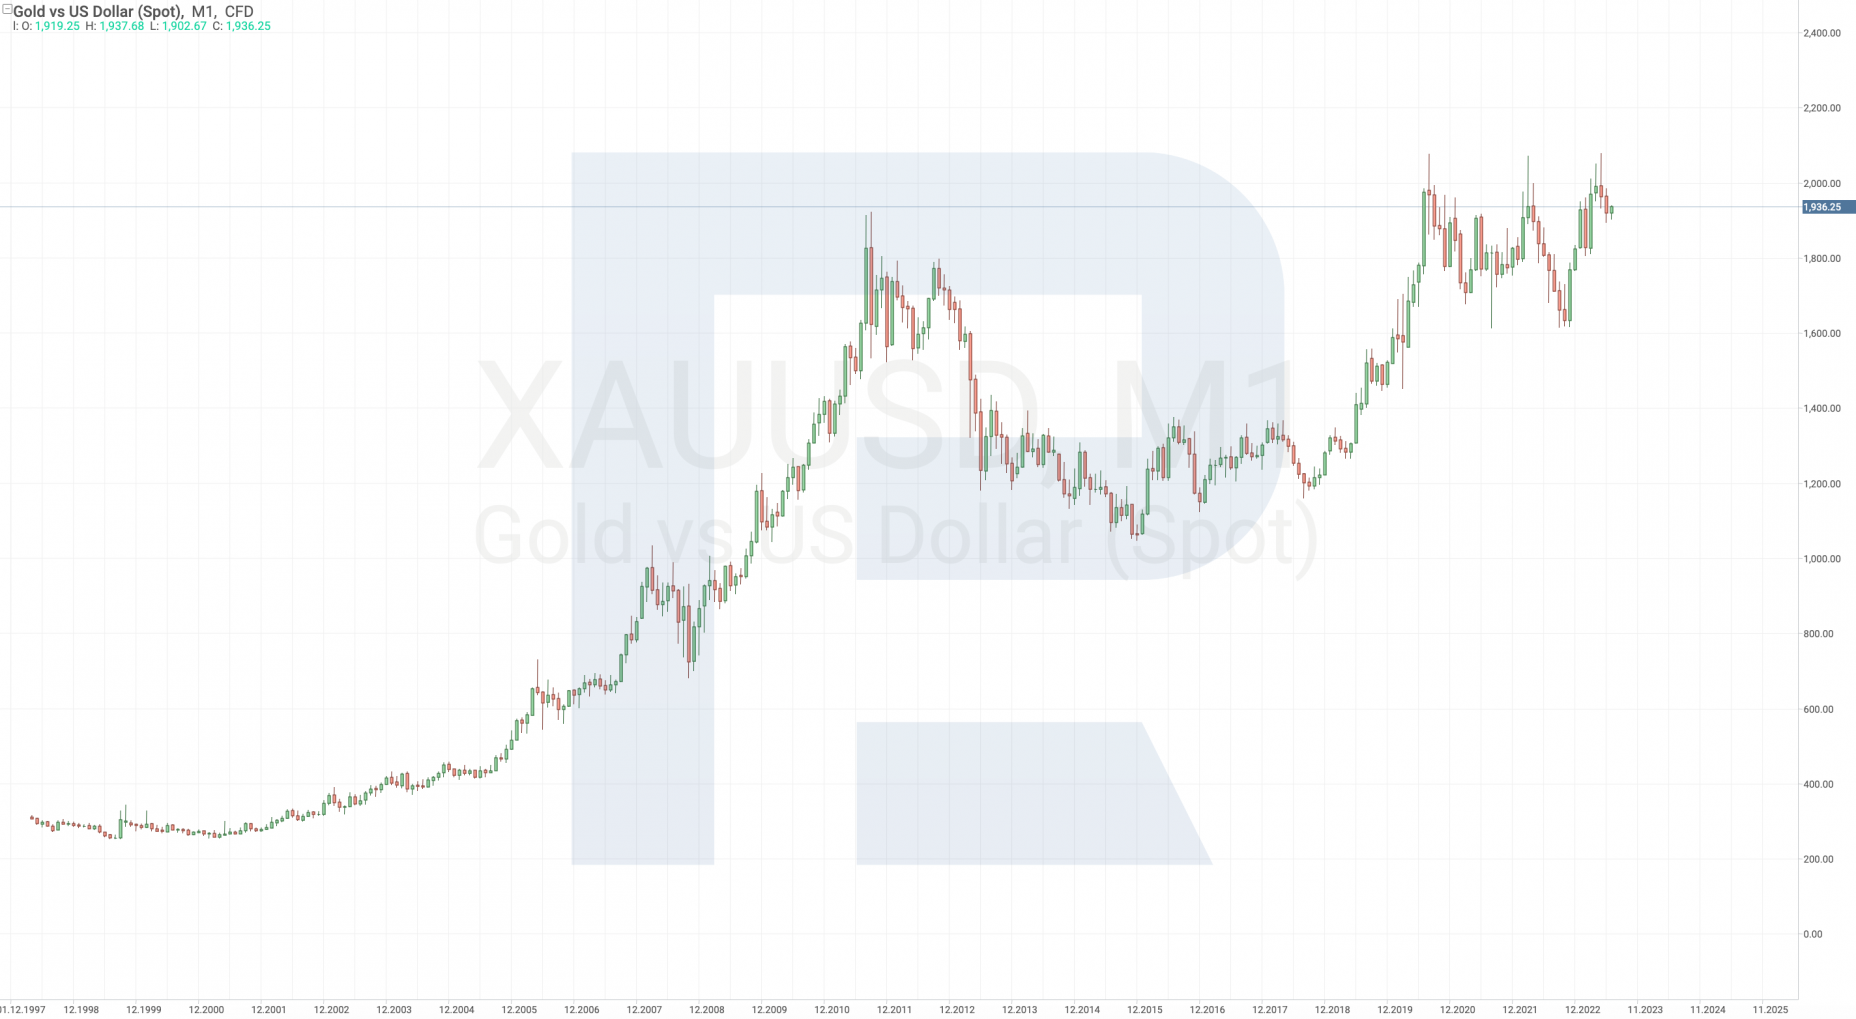
Gold started to rise in price in 2001 amid financial crises, geopolitical tensions, and market uncertainty, with the quotes hitting a new all-time high of 1,920 USD in 2011. From 2012 to 2016 inclusive, the quotes went down to 1,000 USD. Since mid-2018, the prices resumed their upward movement and reached the level of 2,075 USD in 2020, hitting a new record high of 2,081 USD in 2023.
Take part in the RoboForex partner promotion with a prize pool of 1,000,000 USD. 60 winners receive cash prizes each month! Click on the banner to learn about the participation conditions and join the promotion.

Why invest in gold
- Hedge against inflation. The reserves of this resource and its mining are limited, and therefore its value grows during periods of high inflation when fiat currencies are rapidly depreciating
- Reserve asset. During periods of instability, financial and geopolitical turmoil, investors invest in gold to protect their investments from risks and maintain stability
- Portfolio diversification. Adding gold onto a portfolio reduces the overall risk level for the investment portfolio, as gold prices are characterised by a low correlation with the value of stocks, bonds, and other assets. Conditions are being created to mitigate portfolio volatility
What affects the gold price?
- Macroeconomic indicators. This means inflation, interest rates, unemployment, GDP, and other economic data. For example, a high level of inflation and economic instability may boost the demand for gold as a store of value
- Geopolitics. Investors consider gold a safe haven against risks and uncertainty amid wars, conflicts, sanctions, political instability, and geopolitical tensions. Therefore, demand for gold, as a rule, increases during such periods
- Impact of technology. For example, the development of the cryptocurrency market may negatively affect the demand for the precious metal. Investors might exit their positions in gold and invest in digital assets, being lured by a high level of their volatility
- Supply and demand. This asset will increase in price in case of strong demand, for example, from investors and jewellery companies or reduced supply caused, for instance, by mining restrictions or a shortage of new deposits
Participate in the RoboForex partner promotion with a total prize pool of 1,000,000 USD! Click on the banner to learn about the participation conditions and join the cash prize draws.

Analysis of gold prices today
On the XAU/USD daily chart, the price is moving in a downward correction, after testing a high close to 2,081 USD. In August 2020 and March 2022, buyers tried to secure above the level of 2,075 USD, but both attempts to develop a bullish movement resulted in a significant drop in quotes.
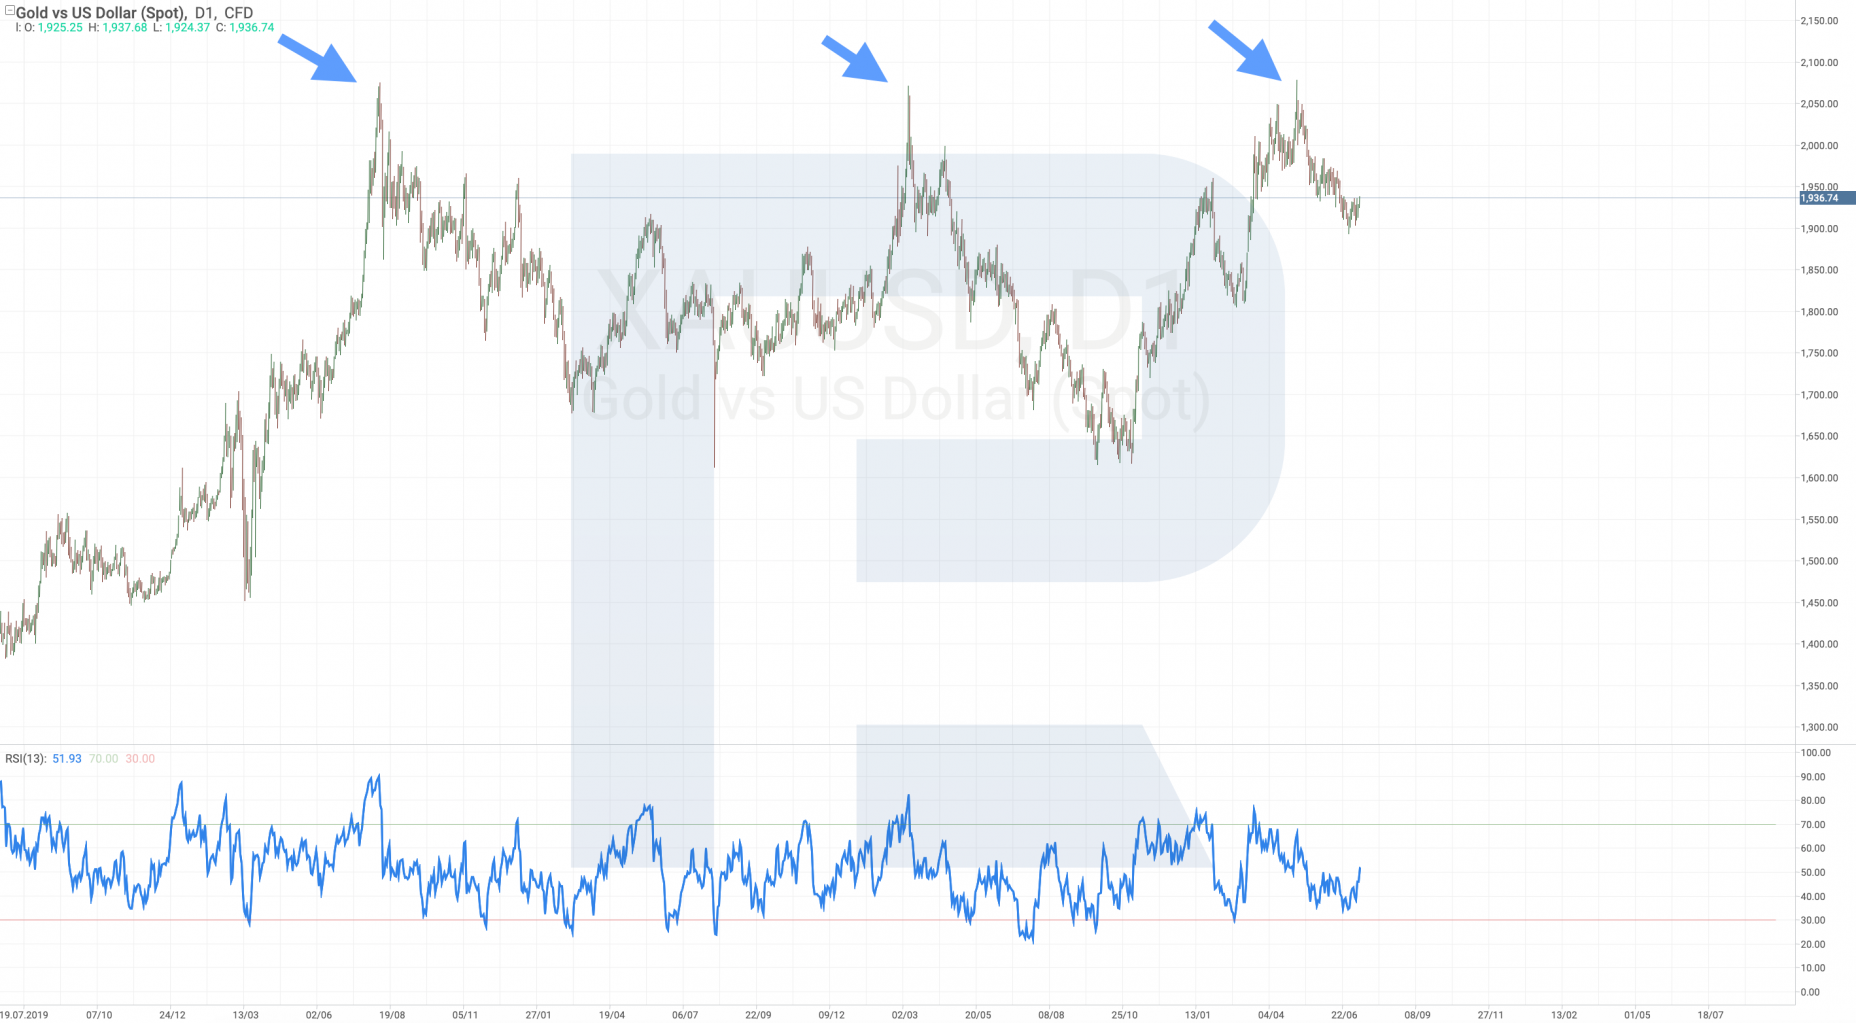
In terms of technical analysis, the current new structure resembles the formation of an ascending 5-0 pattern, which comprises five points. The first point X formed around 1.685 USD, which was followed by a rise in price. Point A is located at the level of 1,806 USD, and after its formation the price dropped and point X hit a new low. Point B formed next to 1,620 USD. An aggressive surge in price to the level of 2,078 USD followed, and this is where point C formed.
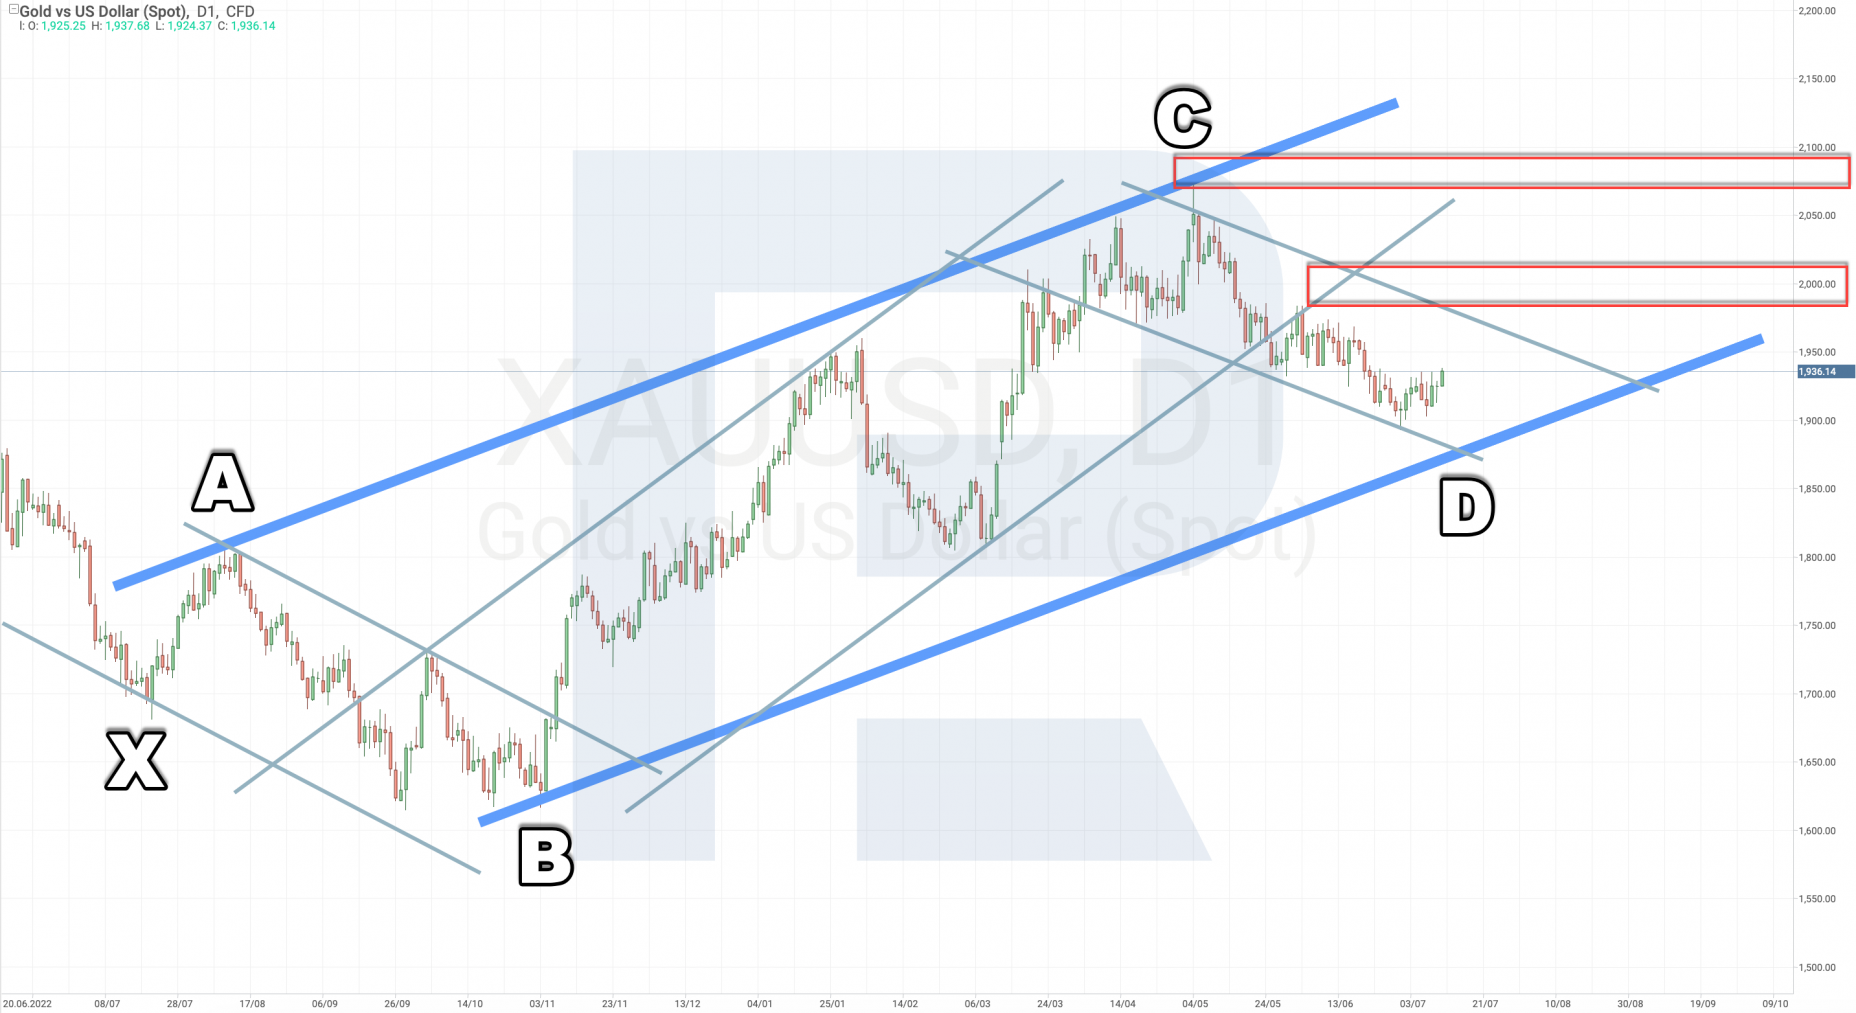
The price is currently moving to complete the formation of the final point D, which can be expected at the level of 1,888 USD. In addition, a test of this level will indicate that the formation of the entire ascending 5-0 pattern is completed and a move to new peaks could follow. The nearest growth target is 2,005 USD. While completing the pattern, the price could rise above the level of point C, which is why growth targets could be at the level of 2,080 USD and higher.
The bullish scenario with the completion of the 5-0 pattern can be cancelled if the quotes fall and secure under the level of 1,860 USD. Such a price movement will indicate a breakout of the lower boundary of the pattern and a further decline to the levels of 1,795 USD and 1,668 USD.
The main drivers of gold prices in 2023
Central bank purchases
According to the World Gold Council (WGC), demand for gold from central banks hit an all-time high in 2022, amounting to 1136 tonnes. This is the highest reading over the entire history of monitoring since 1950. Already in the first quarter of 2023, the demand from central banks reached a level of 228 tonnes, which is 176% higher than in the first quarter of the previous year.
According to the data obtained, experts expect an upward trend in demand to persist throughout the year. The WGC survey showed that 24% of central banks are ready to increase their gold reserves in the near future, which can lead to a rise in gold prices.
Jewellery demand
According to the WGC, the fourth quarter of 2022 saw heavy demand for gold jewellery – over 630 tonnes. In the first quarter of 2023, the demand increased by 1% to 448 tonnes compared to the Q1 2022 statistics.
Despite the overall aggravation of the global economic environment, jewellery production and consumption remain at a high level, with the demand over the past ten years ranging between 840 and 2,100 tonnes a year.
China is the largest gold jewellery market in the world with annual sales of 700 tonnes. If the country eases or lifts COVID-19 restrictions and China’s economy resumes developing, this can have a positive effect on gold prices in the short term.
Gold supply
In 2022, 76% of the total gold supply in the world was from mine production, while recycled gold accounted for just 24%. According to WGC, supply for the first quarter of 2023 totalled 1,174 tonnes, up 1% from the first quarter of 2022.
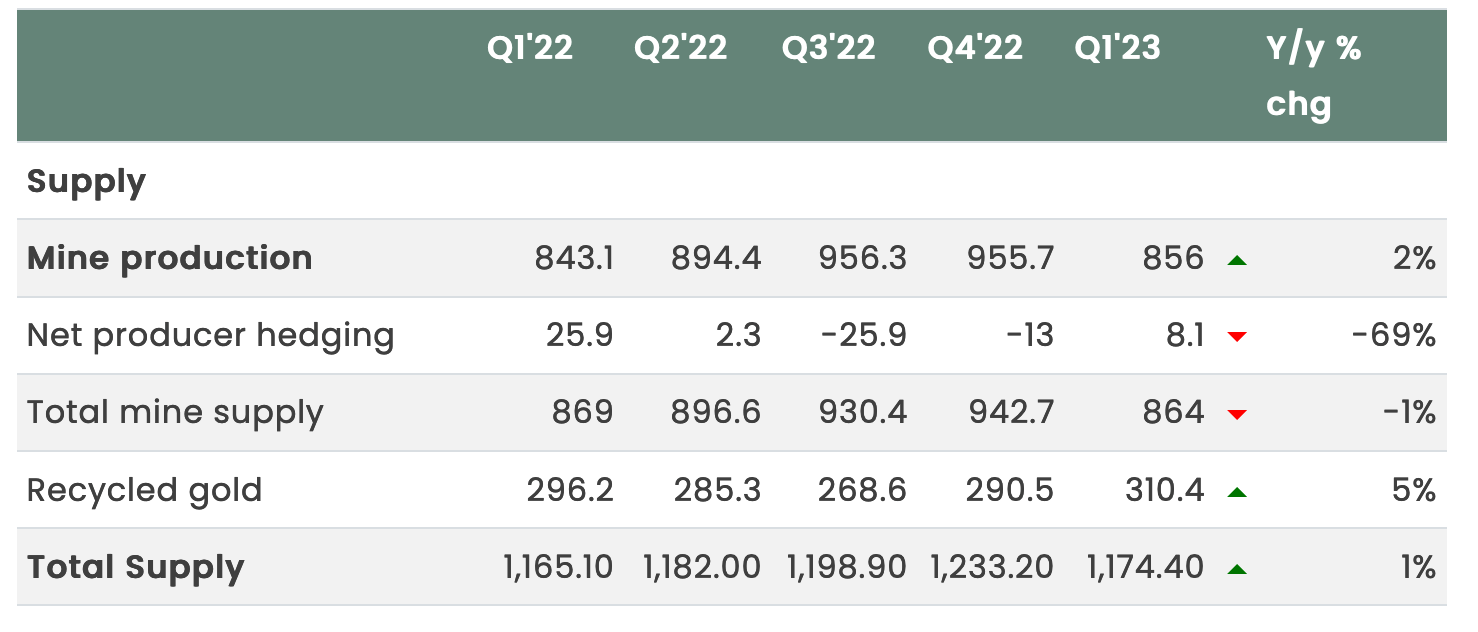
The increase in supply is driven by strong production growth, which is recorded at 856 tonnes (the highest indicator in Q1 since 2000), and an increased volume of recycling at the level of 310 tonnes. According to experts, an increase in recycling is attributed to a rise in the price of the precious metal. It should be noted that despite limited reserves and the complexity of mine development the output remains high, which may have a negative impact on gold quotes.
Tightening of the Federal Reserve monetary policy
Interest rate hikes by the Federal Reserve System (Fed) usually lead to the strengthening of the US currency. As a result, the value of the precious metal, which is traded in dollars, drops, which reduces the demand for gold from investors using other currencies.
One of the main reasons for gold depreciation in 2023 is the tightening of monetary policy by central banks, especially the Fed. The situation can change when the US regulator will have to cut interest rates.
Experience trading in the high-tech R StocksTrader terminal! Real stocks, advanced charts, and a free trading strategy builder. Click on the banner and open an account!

Gold price forecasts for 2023
- Ole Hansen, head of commodity strategy of Saxo Bank, expects gold to rise to 3,000 USD. One of the main reasons is heightened geopolitical tensions. The war economy is growing, and the desire to reduce dependence on foreign exchange reserves is increasing, which boosts the demand for the precious metal
- Juerg Kiener, managing director and chief investment officer of Swiss Asia Capital, believes that gold prices could surge to 4,000 USD already in 2023. Recession fears persist, and this could lead to central banks slowing their pace of interest rate hikes and make gold more attractive to investors
- Kenny Polcari, senior market strategist at Slatestone Wealth, agrees that it is important for an investor to have gold in their portfolio but sees no reason for an aggressive surge above 4,000 USD. At the same time, he notes that much will depend on how inflation reacts to interest rate hikes globally
- Nikhil Kamath, co-founder of India’s largest brokerage Zerodha, recommends allocating 10% to 20% of investor’s portfolio to gold, referring to it as a relevant strategy for 2023
- UBS analysts predict that gold will rise to 2,100 USD by the end of 2023 and secure above the level of 2,200 USD by the middle of 2024. The reasons for the rally are robust demand for this asset from central banks and the weakening of the US currency
Summary
Gold remains an attractive instrument for investments as it is believed to be a reliable store of value over the long term. Despite its current drop in price, market participants are not losing interest in gold since there are several fundamental reasons for a potential resumption of a bullish rally on the gold price chart.
Experts, including those mentioned above, forecast that the cycle of interest rate hikes by the Fed will end, while gold purchases by central banks continue to grow. In this case, the quotes could reach between 2,100 and 4,000 USD, they say. Technical analysis suggests that gold will attempt to rise while developing a bullish 5-0 pattern, provided that buyers are able to keep the level of 1,860 USD from breaking down.
The post Gold Price Forecast for 2023: Analyzing the Potential for Continued Growth appeared first at R Blog - RoboForex.


