Sandbox Coin Price Shoot 8% Today; Is It The Beginning Of A Recovery Rally?
The crypto market witnessed a fresh recovery rally since the beginning of the year 2023. Similar to a majority of altcoins, the Sandbox coin experienced a sustained rally since last week, registering a 22.5% growth. The coin price currently trades at $0.46 and shows further growth potential under the influence falling channel pattern. Key points: The post Sandbox Coin Price Shoot 8% Today; Is It The Beginning Of A Recovery Rally? appeared first on CoinGape.


The crypto market witnessed a fresh recovery rally since the beginning of the year 2023. Similar to a majority of altcoins, the Sandbox coin experienced a sustained rally since last week, registering a 22.5% growth. The coin price currently trades at $0.46 and shows further growth potential under the influence falling channel pattern.
Key points:
- A falling channel pattern is currently leading to the ongoing downfall in SAND price.
- A bullish breakout from the $0.46 resistance encourages the SAND price to a 15% jump.
- The intraday trading volume in SAND price is $409.6 Million, indicating a 10% loss.
 Source- Tradingview
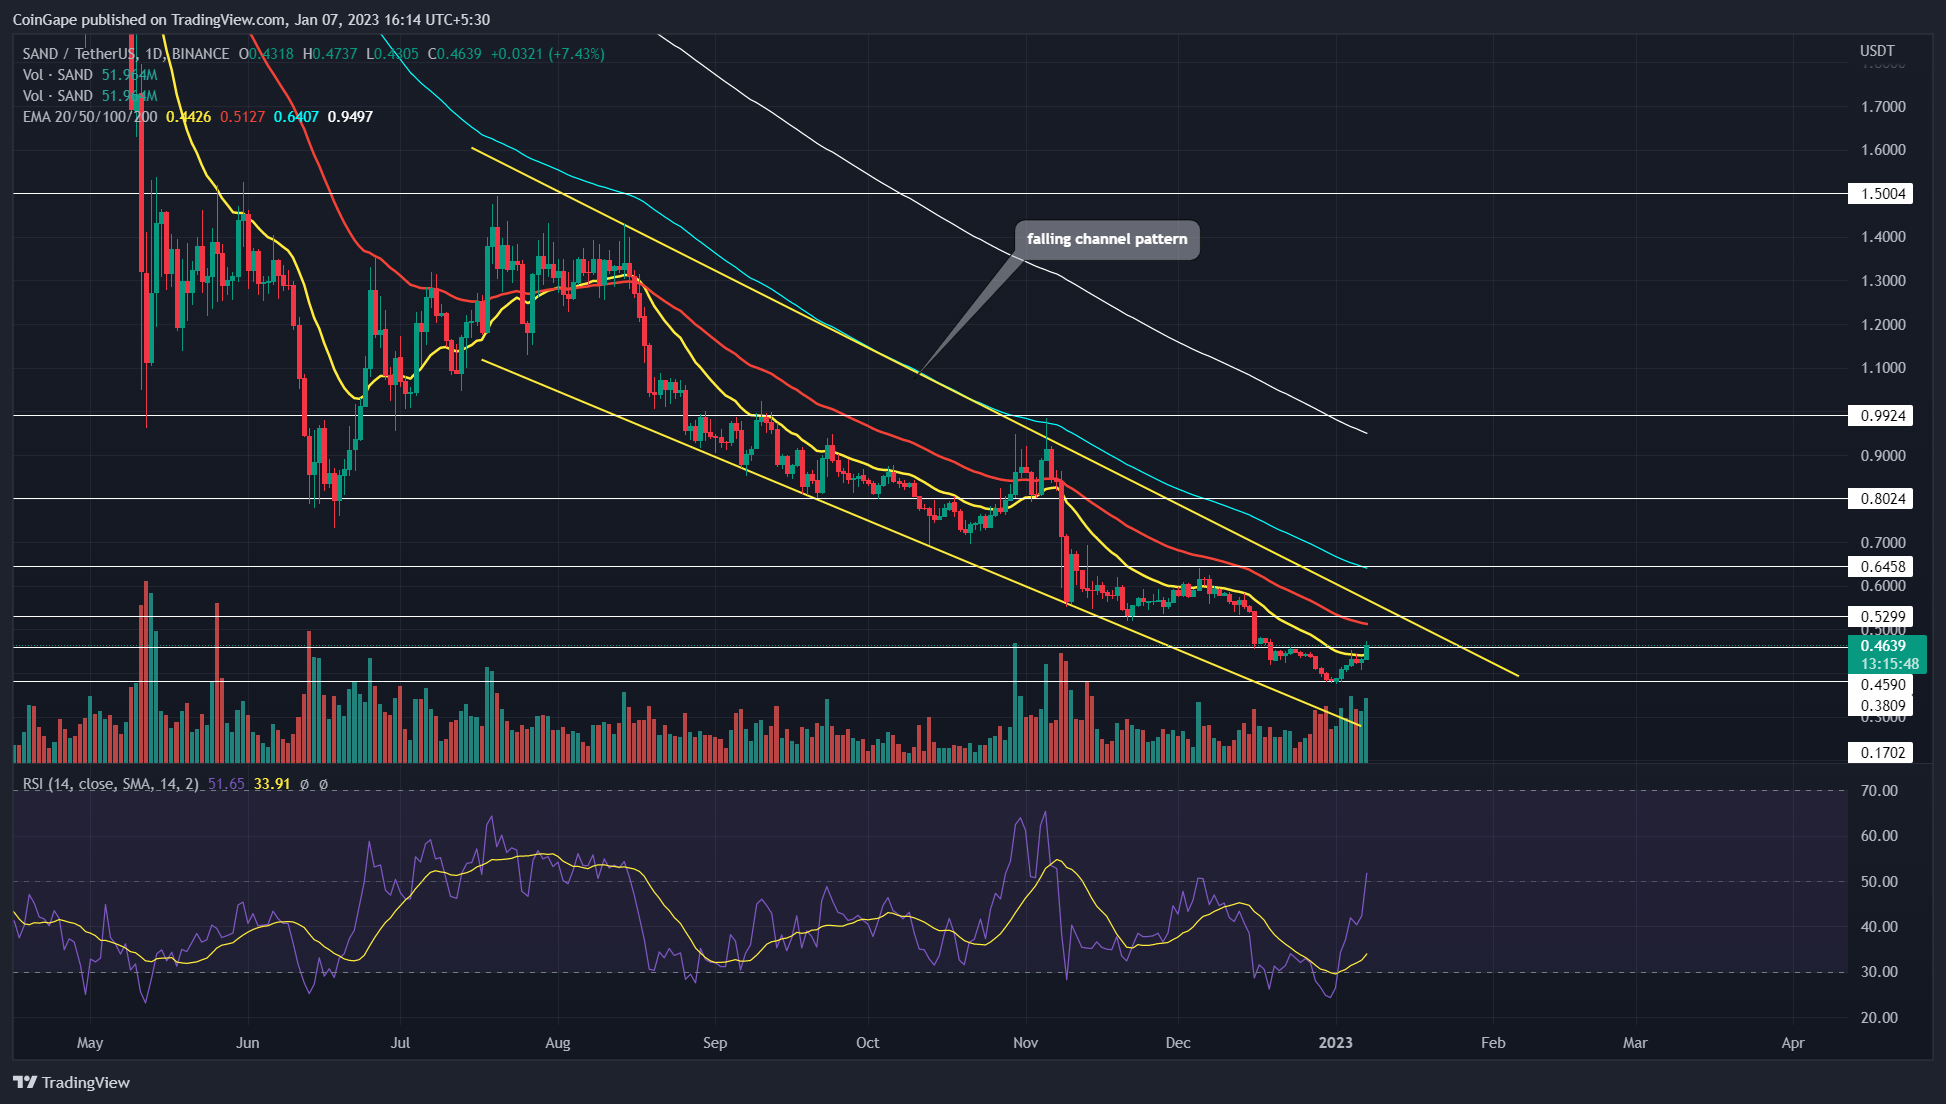
The Sandbox price has shown an established downtrend for the past six months. However, this downfall, led by two parallel walking trendlines, reveals the formation of a falling channel pattern. In theory, even though this pattern leads to a direction downtrend, the prices are encouraged for a massive bullish rally once its breaks the overhead trendline.
Amid the recent recovery in the crypto market, the SAND price showcased a v-shaped recovery from the $0.38 support and surged above a local resistance of $0.46. The long-bullish candle, backed by substantial volume, indicates the commitment of buyers to a bullish recovery.
Also read: Top Metaverse Tokens To Buy For A Great Start Of 2023
Thus, if the daily candle closes above the $0.46 barrier, the buyers may obtain a suitable launchpad to jump high. With sustained buying, the coin price may rise another 15% to hit the resistance trendline of mentioned channel pattern.
Therefore, for the Sand price to ride a directional bull run, the buyers must breach the resistance trendline. In ideal conditions, this breakout may bolster a bullish price rally to the top swing-high of the pattern, which is $1.5.
Conversely, if the prices show reversal signs at the above trendline, the ongoing downtrend will prolong for a few more trading sessions.
Technical indicator
RSI: The daily RSI slope shows a sharp recovery from an oversold region to a bullish territory indicating the intense buying pressure in the market.
EMAs: With the $0.46 resistance breakout, the SAND price also breached the 20-day EMA slope offering an extra edge for coin buyers.
Sandbox Coin Price Intraday Levels
- Spot rate: $0.46
- Trend: Bullish
- Volatility: Low
- Resistance level- $0.53 and $0.64
- Support level- $0.46 and $0.38
The post Sandbox Coin Price Shoot 8% Today; Is It The Beginning Of A Recovery Rally? appeared first on CoinGape.


