Four Ways To Detect Trends In Forex Currency Pairs
How to identify a trend in Forex When it comes to Forex trends, there’s an old saying: “The trend is your friend until the end when it bends.” In a trend, a move from one price to other leads to profits and losses for the trader. Generally, there are four significant factors that can trigger […] The post Four Ways To Detect Trends In Forex Currency Pairs appeared first on The5%ers | Funding Traders & Growth Program.


How to identify a trend in Forex
When it comes to Forex trends, there’s an old saying: “The trend is your friend until the end when it bends.”
In a trend, a move from one price to other leads to profits and losses for the trader. Generally, there are four significant factors that can trigger these trends. These include supply and demand, a change of government policy, speculation and expectation, and international transactions.
Let’s say we’ve developed an edge that involves paying attention to the economics and politics in country X, and we’ve formed an opinion on the future direction of country X’s currency.
To do this, we’ll probably have an understanding of all four of the above factors, and now we want to take advantage of the change of what we think will happen. Again, we can do this either on a swing trade or a long-term basis.
How, then, do we spot a trend on the charts?
This article is an educational guest post. Tim Thomas wrote it from Tim Thomas Co, Learn to Swing Trade for Wealth and Financial Freedom.
Top Techniques to Detect Forex Trends
This guide will explain the different ways to detect Forex trends in currency pairs. You can apply my methods to other markets, but for now, let’s focus on the forex market. Keep in mind this process should be part of a larger strategy, such as swing trading forex chart patterns, but whatever your strategy, it should be backtested and show promise.
Check out the guide below.
Spotting Highs and Lows
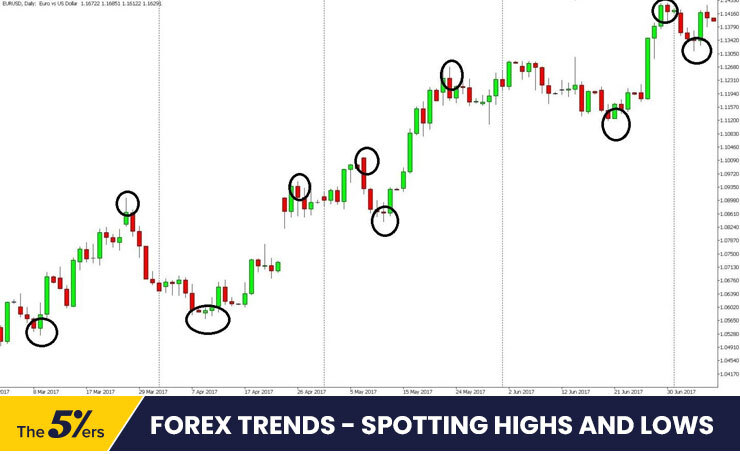
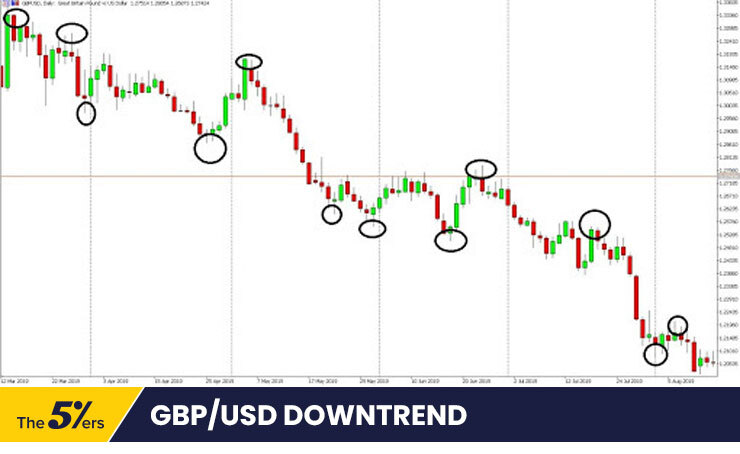
The first method aims to help you identify a trend with your naked eye. We can spot an uptrend on the charts with “higher highs” and “higher lows.” If we are bearish about the currency, we can see a downtrend with “lower highs” and “lower lows.”
Below is an example of an uptrend, as seen with the naked eye. This chart is the EURUSD pair on the daily charts. Notice that it has higher highs and higher lows.
EURUSD Uptrend
The next example is a downtrend. It’s the daily chart of the GBPUSD. Again, we’re just eyeballing the chart. Check out the lower highs and lower lows.
GBPUSD Downtrend
Key Points:
Spotting highs and lows are the first step to learning how to find a Forex trend. I’ve placed it at the top of the list because it requires no indicators. This is an example of pure price action.
The process is very straightforward to understand and put to use. However, this isn’t the best (or even the only) method we should use when spotting Forex trends.
Using ADX to identify a Forex trend
The average Directional Index (ADX) is a momentum indicator used to determine trend strength. Developed by Welles Wilder, it indicates that a strong trend is in place if the value is above 25. If the ADX value is below 20, it means the trend is weak or there’s no trend at all.
Two separate indicators make up the ADX. These are the Positive Directional Indicator (+DI) and the Negative Directional Indicator (-DI).
The crossover of these two indicators can indicate a signal to open a trade. For example, if the +DI crosses above the -DI and the ADX is above 25, this is a signal to enter a long trade; It indicates that an upward trend in price is likely to occur.
On the other hand, if the -DI crosses above the +DI and the ADX is above 25, this is a signal to sell.
Take a look at the example below of the USDJPY on the 30-minute chart.
It has a 14-period ADX and two lines on the chart at 20 and 25. The green line refers to the ADX itself. The blue and red lines refer to the +DI and -DI, respectively. We enter a short once the -DI crosses above the +DI and the ADX is above 25.
USDJPY ADX Initial Short
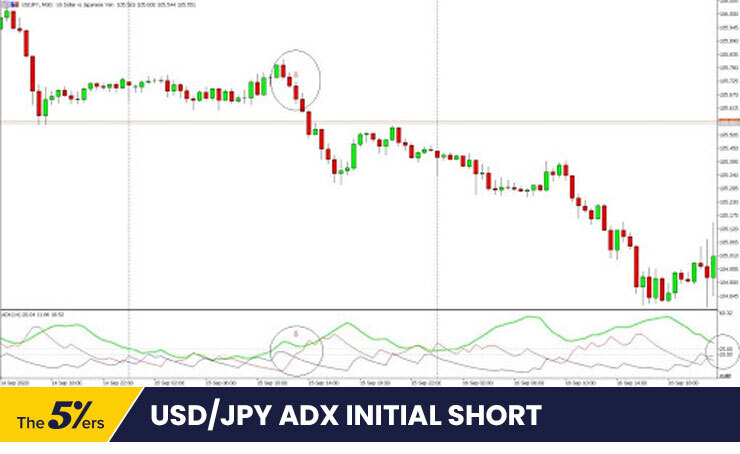
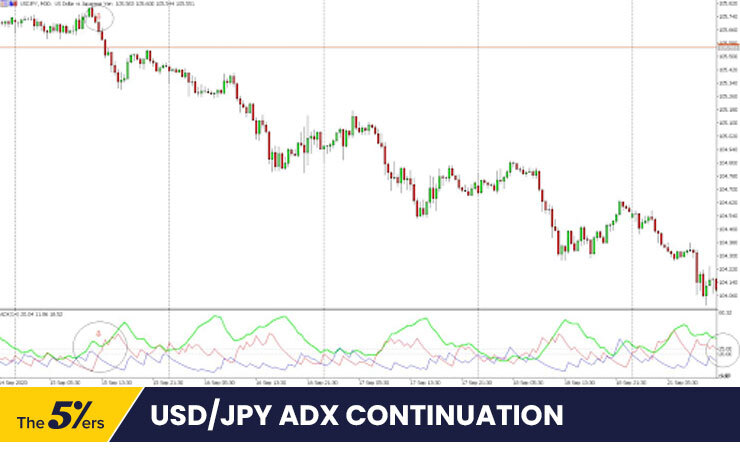
The two red arrows in the above chart indicate the beginning of the trade. In this case, we are short the USDJPY. Over the following days, we can see that the trend in this 30-minute chart continued for the next four days.
USDJPY ADX Continuation
Key Points:
While ADX is a great way to measure the “strength” of the trend, we can also use it to detect the early stages of a move. We can implement this by using the crossover of the +DI and -DI.
Additionally, while it’s possible to use ADX as the sole indicator for trading, we can also combine it with other indicators, such as Moving Averages (MA). You can even price action patterns to detect reversals. This will enable you to catch early moves for high-probability trades. Like all strategies presented here, this needs to be backtested to test for its potential profitability.
Using A Single Moving Average
Trend-following strategies use MAs to spot significant movements in price. The simplest way to use MAs is to plot a single instance of this indicator on the chart.
Generally, when the price stays above the MA, the currency pair is in an uptrend. Conversely, if the price remains below the MA, the instrument is in a downtrend.
Below is an example of spotting a trend using a 200-period MA. The chart shows GBPCHF in the daily timeframe.
GBPCHF Uptrend Using Moving Average
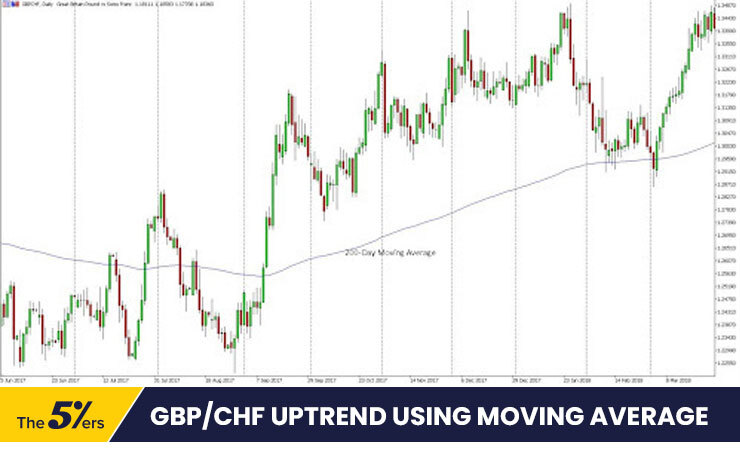
Notice that before the trend appeared, GBPCHF went into a period of consolidation. In this area, the price moves above and below the 200-day MA back and forth. At the latter part of the chart, you will see that it will test the 200-period MA as it becomes a support level.
The picture below shows the continuation of the trend. Finally, GBPCHF formed a double top and finally consolidates before reversal.
GBPCHF Uptrend Reversal Using Moving Average
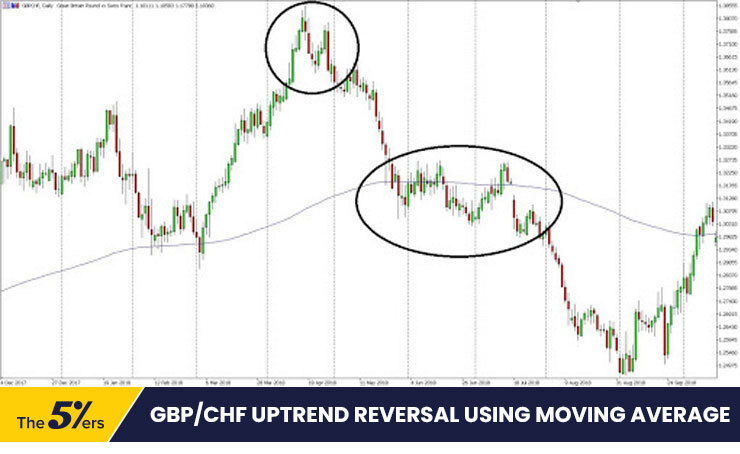
Key Points:
MAs are lagging indicators. They are calculated “after the fact,” i.e., they always follow the price itself. Similar to ADX, you can use MAs in conjunction with other indicators or with price action strategies to catch early moves.
Using Multiple Moving Averages
Multiple MAs lined up in the right manner are a more decisive confirmation of a trend in place. In an uptrend, the price should be above the MA. Additionally, the shorter period MA should be above the one the longer period MA.
The inverse is also true. In a downtrend, the price should be below the MA. And the MA with a shorter period should be located below those with longer periods.
Let’s look at the example below. This is the GBPJPY chart based on the 4-hour timeframe.
We can see three different MAs – the red, green, and blue lines represent the 50, 100, and 200 periods. Check out how the MAs line up or bunch near each other. You will notice it in the earlier parts of the chart where consolidation is taking place.
GBPJPY Downtrend Using Multiple Moving Averages
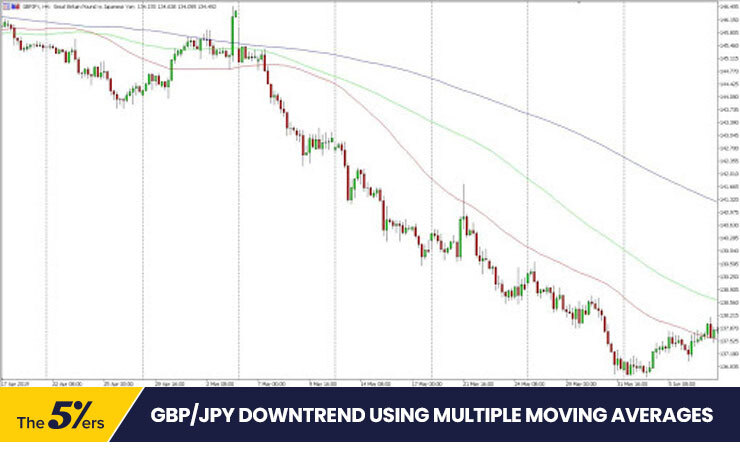
Once the MAs line up in the right manner, a downtrend occurs. In this case, the 50-period MA (red) is below the 100-period MA (green). These two are located below the 200-period MA (blue). Plus, the price is below all three MAs.
In the chart below, you can check out the continuation of this trend. In the middle portion of the chart, you can see that the MAs are tested as resistance levels. In the latter part of the chart, we can see another consolidation before it reverses back up.
GBPJPY Downtrend Continuation
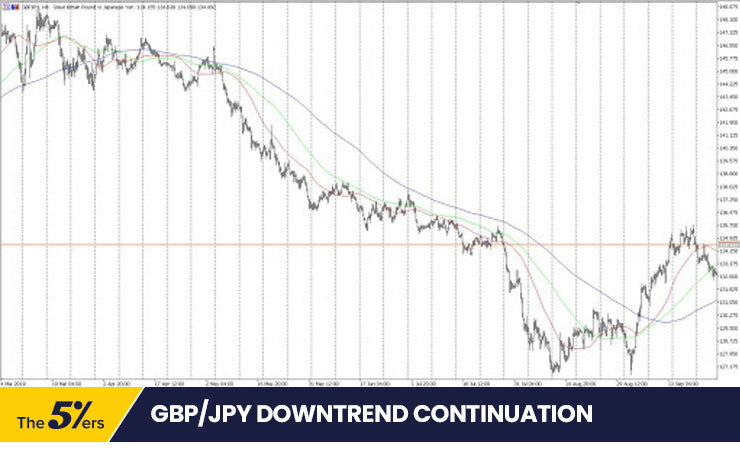
Key Points:
Using multiple MAs can be a stronger indication of a trend compared to a single MA. However, since you have to wait for all MAs to line up in the right fashion, there’s a risk a trend could be joined late.
Recap: Detecting Forex Trends In Currency Pairs
- Spotting Highs And Lows
- Using ADX
- Using A Single Moving Average
- Using Multiple Moving Averages
Trend trading is a well-used trading strategy. The research proves that used in the right way, it can be very profitable. For forex traders, early identification of the trend using one or a combination of the above could be a strategy by itself or part of a wider strategy such as swing trading.
Although the above is useful for spotting trends, the industry is moving towards algorithmic trading – trading by computers. Defining the trend according to your own interpretation and translating that into a programming language can remove the subjectivity that comes with doing things ‘by eye.’ It can also go a long way toward developing a consistent process. Also, don’t forget to backtest and forward-test your strategy on ample amounts of data.
 If you want to receive an invitation to our live webinars, trading ideas, trading strategy, and high-quality forex articles, sign up for our Newsletter.
 Click here to check our funding programs.
 Don’t miss our Forex Trading Ideas.
Follow us:  YouTube
  Linkedin
  Instagram
  Twitter
  TradingView
Author bio
My name is Tim Thomas, Born in Guildford and now living near Southampton, UK, with my family. I started my career in the financial markets and have traded and invested in stocks, options, FOREX, futures, crypto, and real estate. My website is dedicated to helping you learn and master swing trading to reach your wealth and financial freedom goals.
The post Four Ways To Detect Trends In Forex Currency Pairs appeared first on The5%ers | Funding Traders & Growth Program.


